A signal is only
the beginning.
Learn to read a signal, keep a useful journal and make sense of the results. A practical field guide, with examples you can explore.
A learning guide with illustrative data. No account needed.
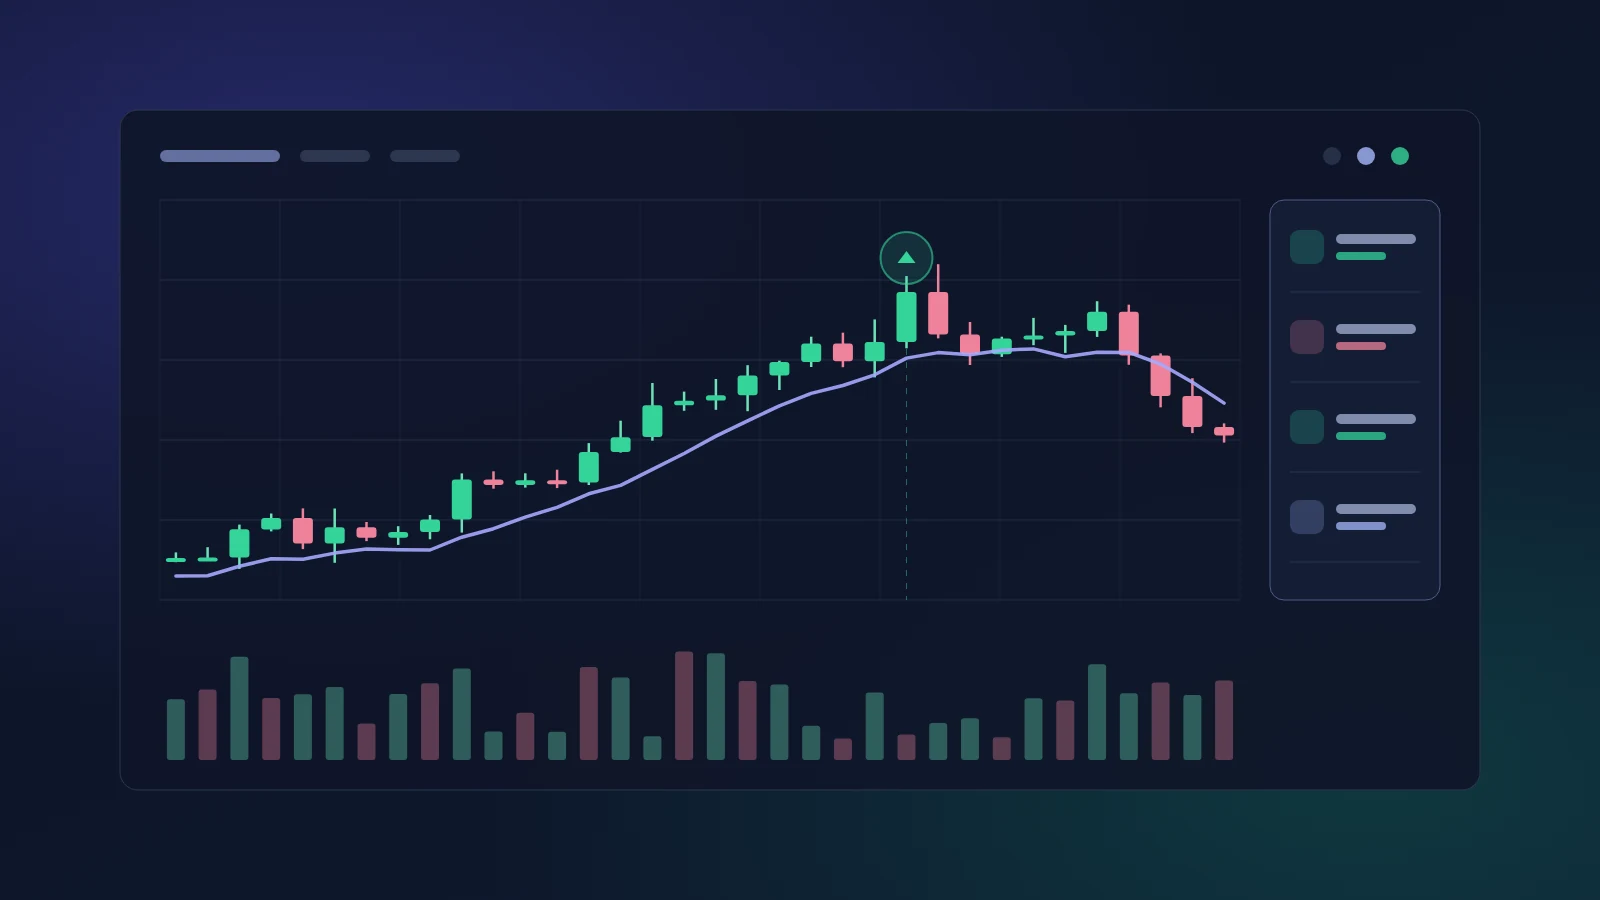
An animated chart: signals appear on the price line, wait for their expiry and settle as WIN or LOSS.
Learn to read a signal, keep a useful journal and make sense of the results. A practical field guide, with examples you can explore.
A learning guide with illustrative data. No account needed.
Start with the fields on a signal card, then follow them into a journal and a session review. Read in order, or use the steps to jump to the part you need.
An asset, a direction, an expiry and a confidence score. Read each field before looking at the result. The notes beside this example explain what you are seeing.
Asset. The instrument named by the signal.
Direction. CALL expects a higher price at expiry; PUT expects a lower one.
Expiry. The time at which the outcome is recorded.
AI confidence. A model score, not a guaranteed outcome.
Result. The recorded outcome of this example.
The model publishes the asset, direction, expiry and confidence.
The price at expiry is compared with the entry price.
WIN if the price moved the signal’s way, LOSS if not. Both count in the statistics.
Your journal connects the published signal with what actually happened. Keep these details beside the signal fields so you can compare like with like later.
The actual time and price, including any difference from the signal.
The amount at risk and the payout offered for this example.
The session, relevant news and a short note about the setup.
Watch one journal line take shape, from the time and asset to the result and new balance. The point is a record you can return to after the moment has passed.
Here is the first page of our worked example, grouped into a session review. All figures below describe these 26 illustrative trades, not the performance of a live service.
Percentages rounded to whole numbers.
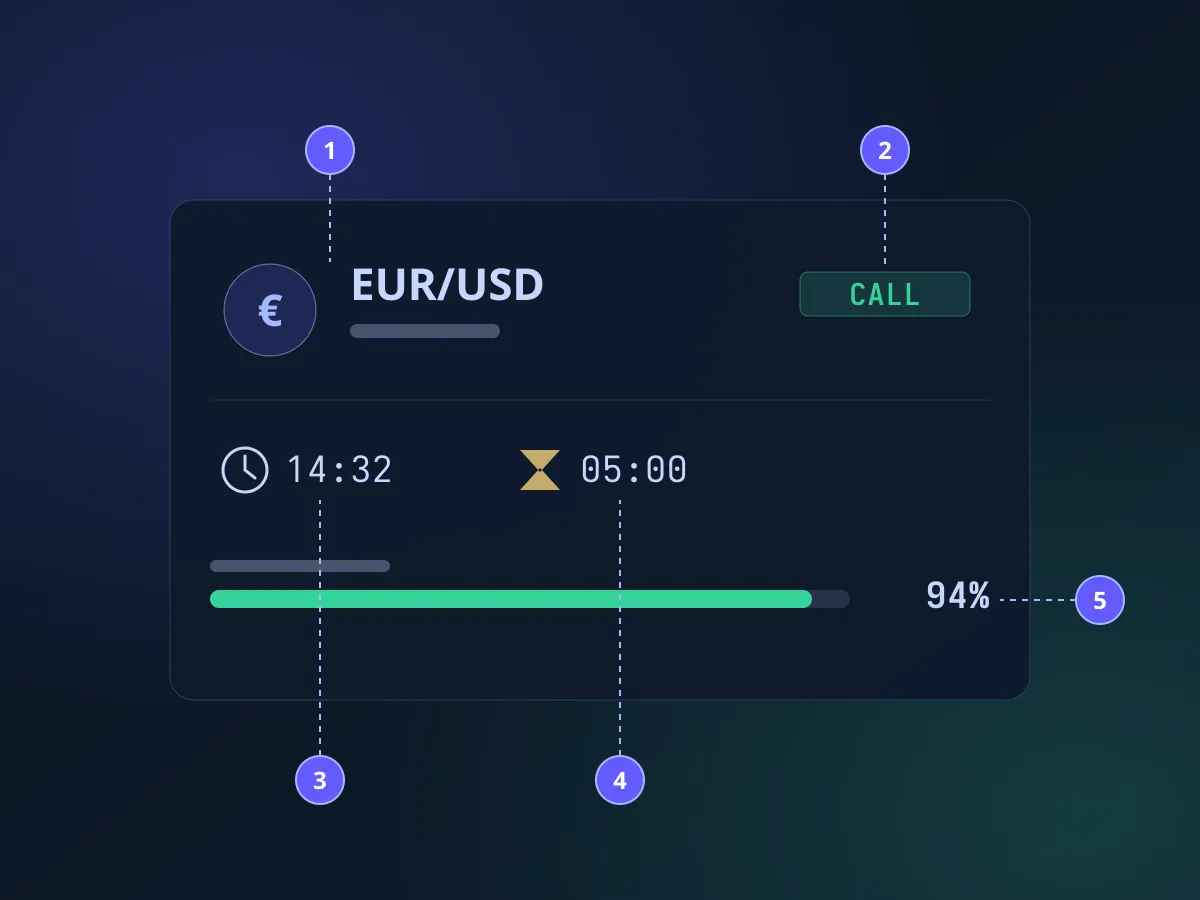
A signal card is a compact record. It names an instrument, describes an expected direction and gives you a time at which to check the outcome. Reading it carefully means keeping those fields separate from the decisions and observations you add yourself.
The annotated image above is our reference. In the example below, EUR/USD identifies the asset and CALL describes the expected direction. Neither field tells you whether an entry was made, what price was available or how much was at risk. Those details belong in a separate journal entry.
Identify the asset. Copy the instrument exactly as it appears, including any suffix that distinguishes it from another market.
Check the direction. Read CALL or PUT before looking at the final outcome. Keep the original label even when the result differs from the expectation.
Separate the times. Publication, entry and expiry describe different moments. Record each one beside its own label.
Published at 14:32
Observed entry at 14:33
Expiry recorded at 14:37
These three lines describe one illustrative record. A later reader should be able to tell which time came from the card and which came from your observation, without reconstructing the order from memory.
Keep the original beside the observation. A useful journal preserves what the signal said and what you recorded, even when the two differ.
A journal works best when related details stay together. Start with the source, add the circumstances and finish with the outcome. The outline below leaves room for a short note without mixing that note into the original signal fields.
The original signal
Asset and direction, copied from the card.
Timing, with the source of each value kept visible.
Publication time shown on the signal.
Expiry time used to record its outcome.
Your observation, including the actual entry time, price and any relevant conditions.
The result, followed by a brief explanation of anything that needs checking.
Use a short identifier such as EURUSD-1432 to connect your note, screenshot and journal row. The identifier is a label for this example, not a new signal field.
Write the record so that someone who missed the moment can still understand what happened.
That includes the details you would otherwise be tempted to leave out.
An early note might say the signal guaranteed a win. Replace that claim with the example recorded a winning outcome. The revised sentence describes the record and makes no promise about another trade.
Keep a reason beside a correction. “Copied the publication time into the entry field” explains why a row changed. “Updated” leaves the next reader guessing. A short, specific note is enough.
Once the entry is complete, continue the same checklist. First check the individual row. Then compare it with the other entries that belong to the same sample.
Verify the source. Match the asset, direction and times against the original card or screenshot.
Check the outcome. Include losses and unresolved entries in the record, with a clear label for each.
Name the sample. Keep its date range and number of entries beside any summary so the reader knows what was counted.
Warning: An example is not a forecast. These records illustrate how to read and document a signal. A confidence score or a past outcome does not guarantee a future result. Trading can result in losses.
Return to the interactive signal examples and compare the feed with the table. Both show the same sample in a different arrangement. Use whichever view makes a particular detail easier to check.
Use the feed to focus on individual entries. Switch to the table to compare assets, directions and results. These are sample records for this guide.
EUR/USDCALL 05:00Today 4 WIN · 2 LOSS
Illustrative entries with their recorded outcomes
| # | Asset | Direction | Entry · expiry | AI confidence | Result | Analysis |
|---|---|---|---|---|---|---|
| 1 | EUR/USDForex | CALL | 14:32 · 5 min | 94% | WIN | Read → |
| 2 | BTC/USDCrypto | PUT | 14:15 · 15 min | 91% | WIN | Read → |
| 3 | XAU/USDCommodities | CALL | 13:58 · 5 min | 89% | WIN | Read → |
| 4 | GBP/JPYForex | PUT | 13:40 · 10 min | 85% | LOSS | Read → |
| 5 | AAPLStocks | CALL | 13:22 · 30 min | 82% | WIN | Read → |
| 6 | EUR/GBPForex | CALL | 14:36 · 5 min | 80% | Pending | Read → |
Times are Kyiv time.
A signal card is the end of a process. This illustrated sequence follows market data through analysis, scoring and filtering to a published record.
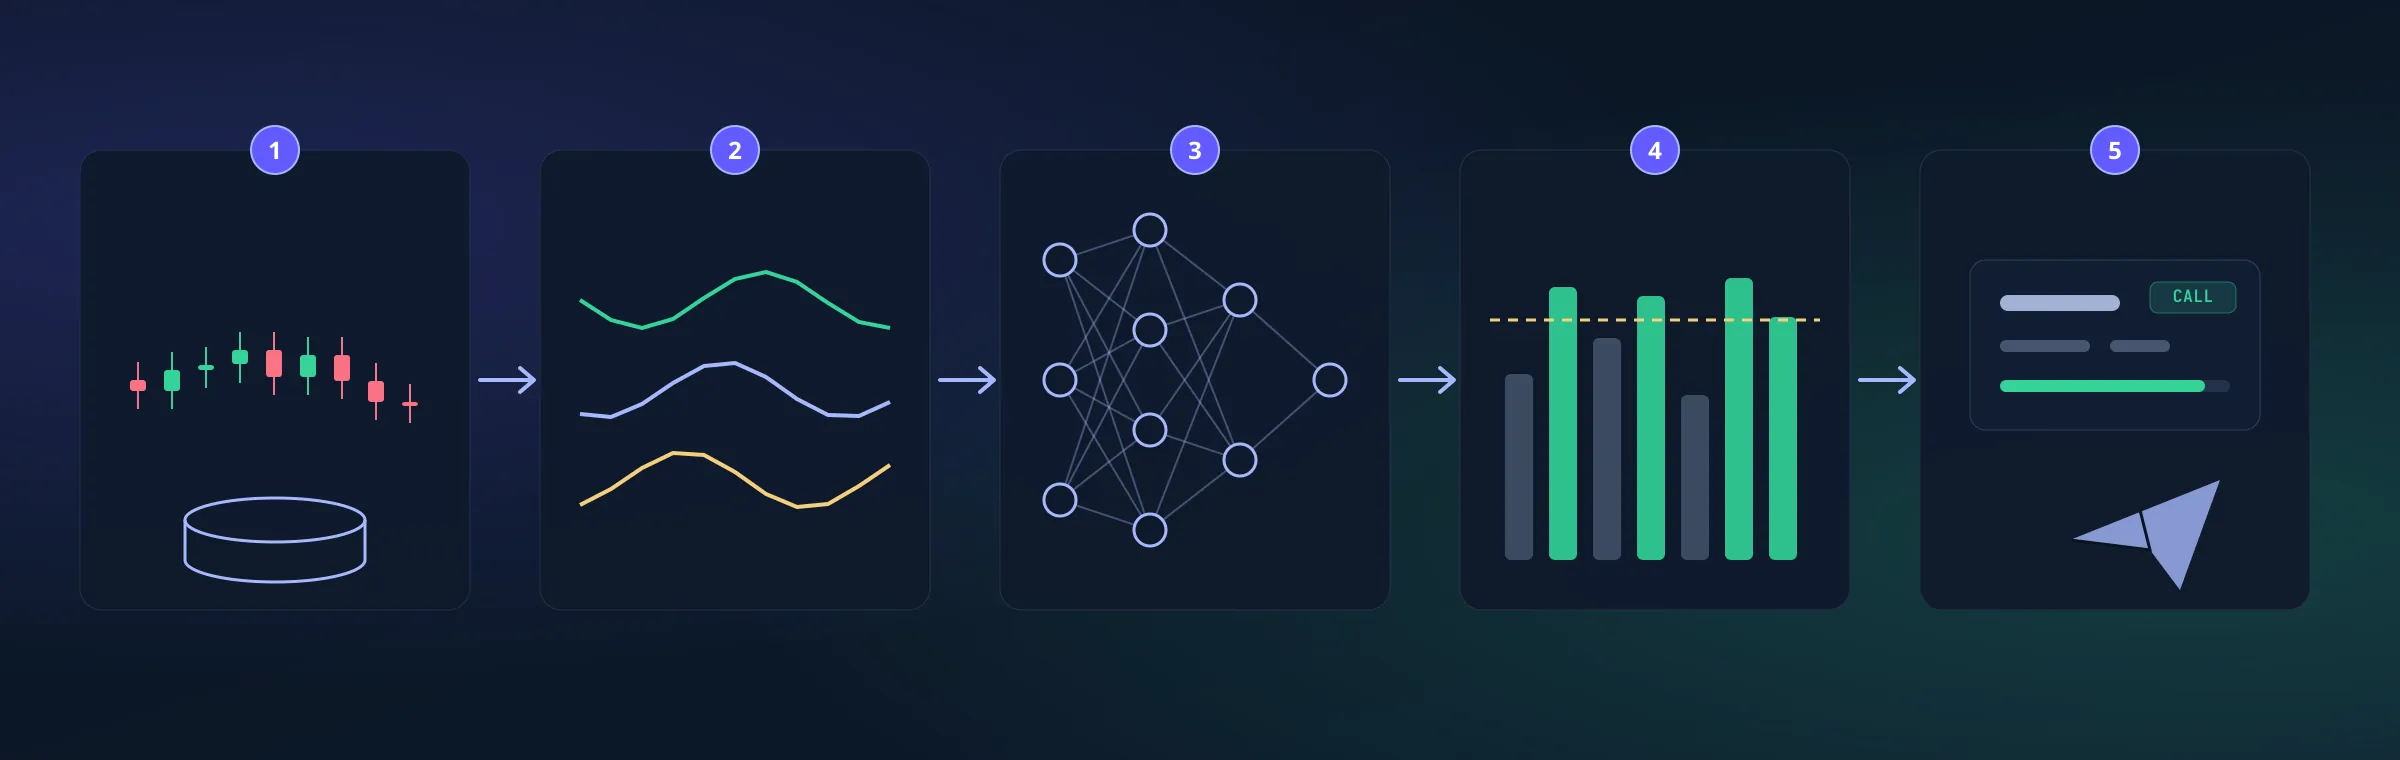
Image 1 of 2
Bring market observations together.
Describe the pattern in the data.
Give the candidate a model score.
Check it against the publication criteria.
Present the fields on a signal card.
A time stamp is more useful when you know the session around it. Use this reference to compare markets and session windows before exploring the examples below.
Session | Opens, UTC | Closes, UTC | Most active pairs | Note |
|---|---|---|---|---|
Sydney | 22:00 | 07:00 | AUD/USD, NZD/USD | The quietest session. Spreads are often wider. |
Tokyo | 00:00 | 09:00 | USD/JPY, EUR/JPY | Overlaps Sydney until 07:00. |
London | 08:00 | 17:00 | EUR/USD, GBP/USD | The busiest session by volume. |
New York | 13:00 | 22:00 | EUR/USD, USD/CAD | Overlaps London from 13:00 to 17:00. |
These two illustrations use the same 200 sample outcomes. Move between them to see how changing the stake changes the balance curve and its deepest fall.
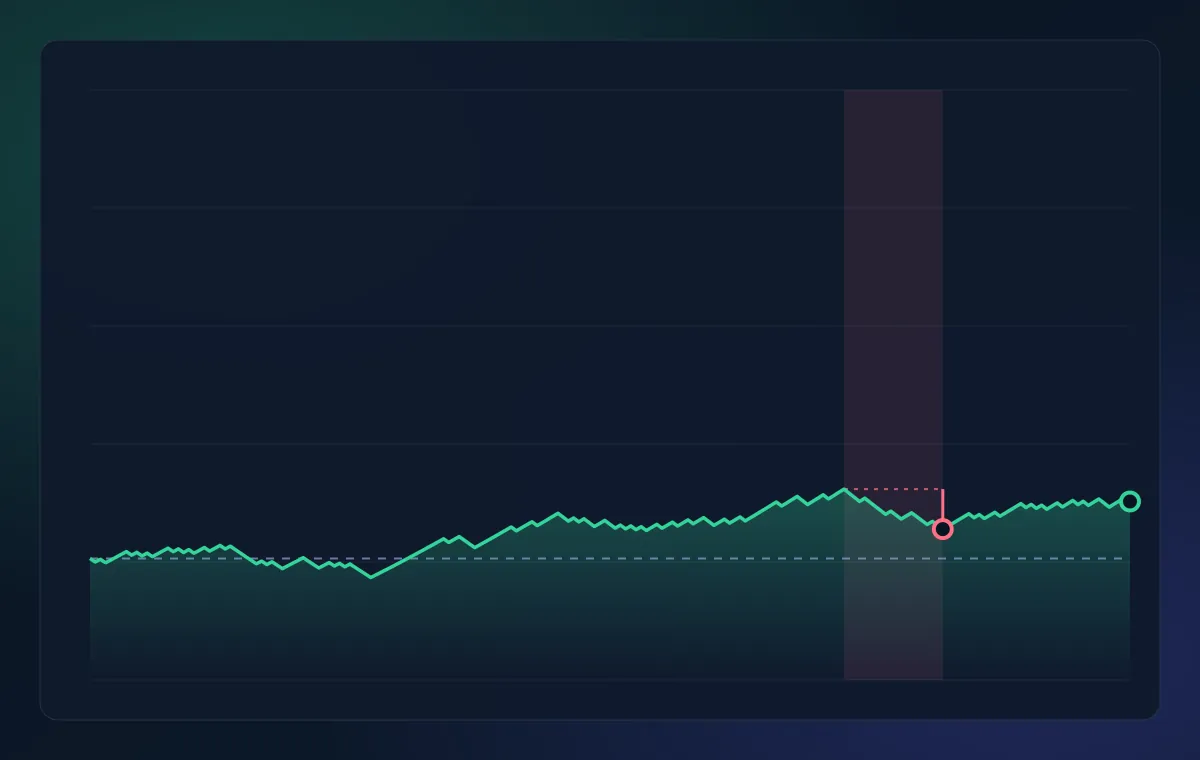
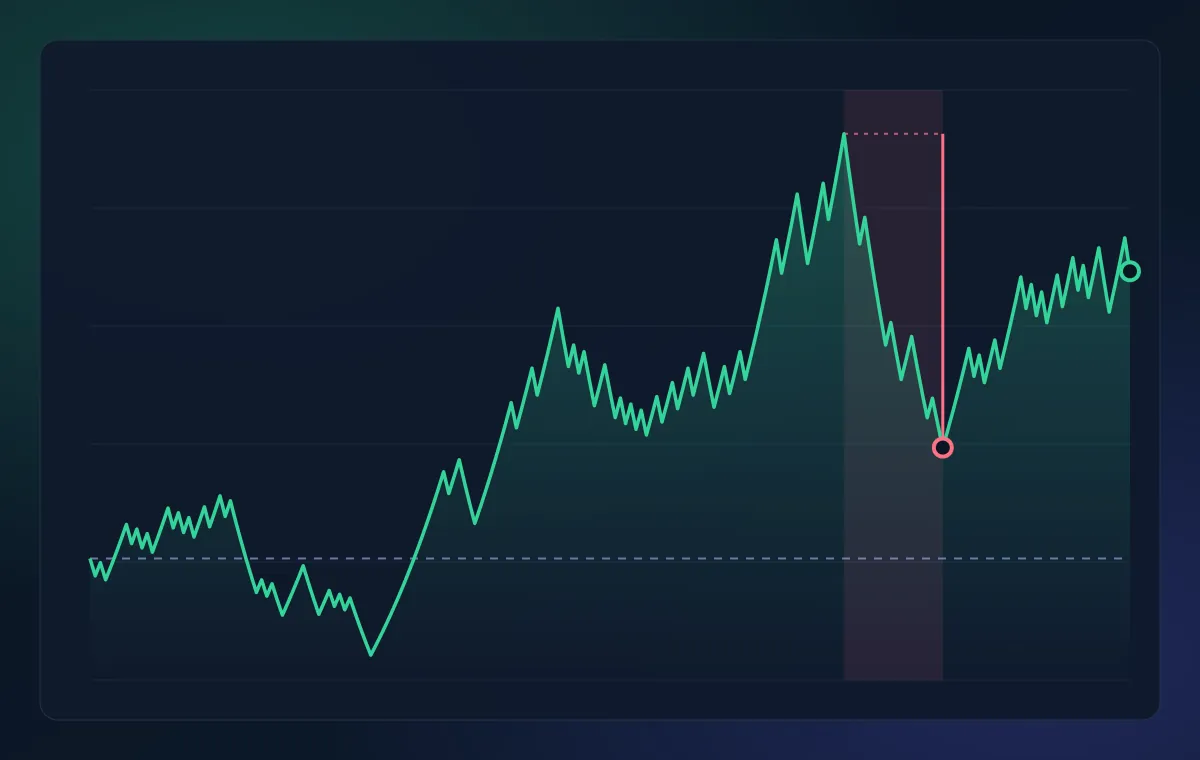
Image 1 of 2
Browse the illustrated fields, then use the reference table for what to write and where to read more.

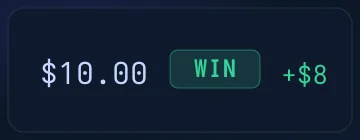

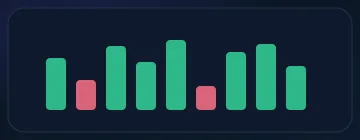
Image 1 of 6
Field | In the journal | What to record | Read more |
|---|---|---|---|
Asset and time | | The asset as the signal names it, and the time you opened the trade, always in the same time zone. | |
Direction | | CALL or PUT, copied from the signal. Never changed on a hunch. | |
Expiry | | The expiry you actually chose. If it differs from the signal’s, write down why. | |
Stake and result | | The stake in money, the outcome and the profit or loss. The balance follows from them. | |
Note | | One sentence on why you took the trade and how you felt. It is the field that explains a losing streak. | |
Weekly summary | | Trades, win rate, average payout, result and deepest fall. Compare like with like. |
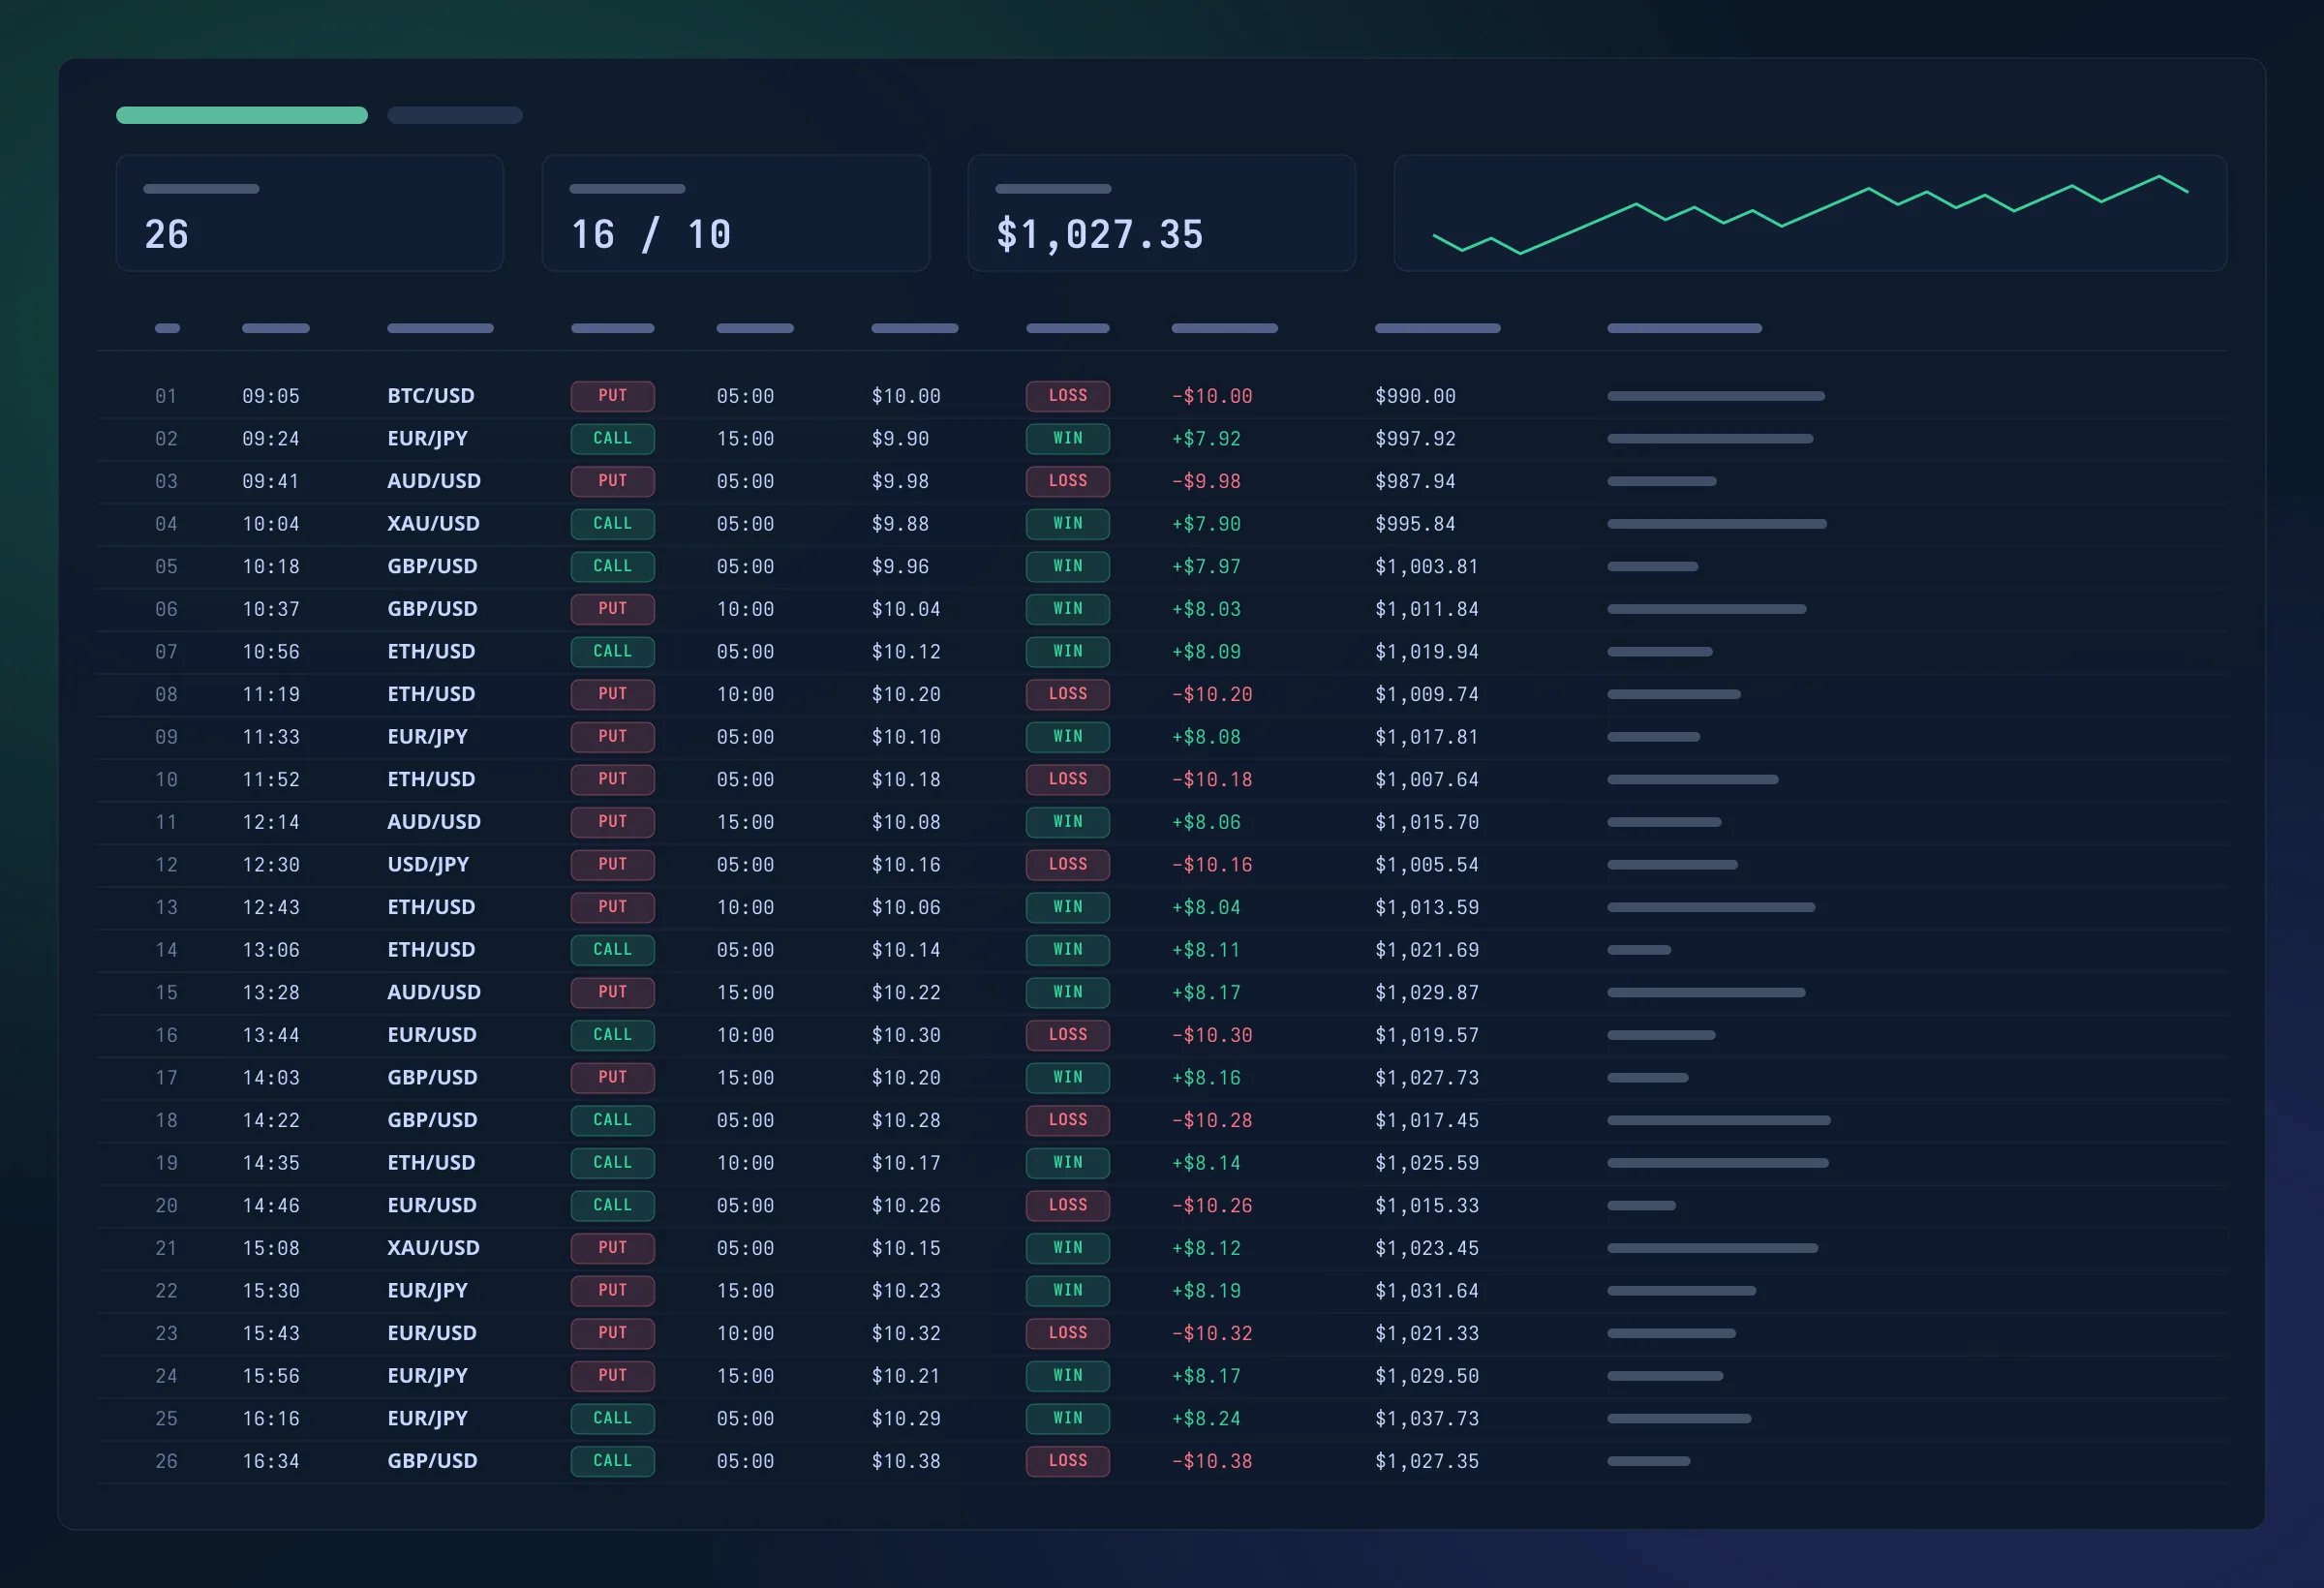
Image 1 of 3
Open the journal page to inspect the 26 entries behind the summary. The other images show the longer 200-trade sequence at two stake sizes.
They belong in the same record as the wins.
Keep its period and trade count beside the result.
Check the stake, payout and entry before comparing two records.
Wins and losses stay in the same sample.
Actual entries and payouts make the result traceable.
A selection of good outcomes hides the rest of the record.
Missing times and amounts leave gaps in the explanation.
Go deeper into the worked example, or revisit a term that needs another look.
How the direction of a signal is marked.
1 min readWhat a single candle shows.
1 min readStakes, limits and drawdown.
12 min readWhat the examples show, how to use them and where to go next.
No. The signals, journal and charts are illustrative examples. They explain how to read and compare records, and do not establish the performance of a trading service.
Start with the annotated signal card. Follow its fields into the journal, then compare the journal page with the session summary.
The session review uses the first 26 entries of the worked example. The two balance curves show the full sequence of 200 outcomes with different stakes.
No. You can read the guide, open the images and explore the sample tables without signing in.
More notes on signals, markets and the habit of keeping a record.
We go through a signal's fields, timestamps and trade direction using one clear example.
Read the fields, follow the journal and compare the results. The examples are here whenever you need another look.
Create a Signal AI account, or keep exploring the public guides. All the examples on this page remain available without signing in.
These examples are educational. Trading can result in losses; illustrative outcomes do not predict future results.
Already have an account? Sign in